Results
The expected return obtained for each policy is given in Table 1.
Policy |
Expected Return |
\(\pi_{OL}\) |
3.40 |
\(\pi_{R}\) |
-10.79 |
\(\pi_{PI}\) |
3.79 |
The open-loop policy yields an average return of $3.40$. As expected, the random policy performs worse, with an average return of $-10.79$. The best-performing policy is the PI controller-based one, with an average return of $3.79$. This result is an improvement over the reference scenario and can serve as a baseline for more sophisticated policies.
A representation of an action (total current) trajectory for each policy is given in Figure 1. This figure shows the erratic evolution of the total current of the random policy, which is somewhat mitigated by the ramp-rate constraints imposed in the environment. Regarding the PI policy, the trajectory of the current increases steadily and levels off at \(15\,\mathrm{MA}\), the maximum value allowable in the environment. This behavior is consistent with the fact that higher values of total current can generally be associated with improved confinement and overall better performance.
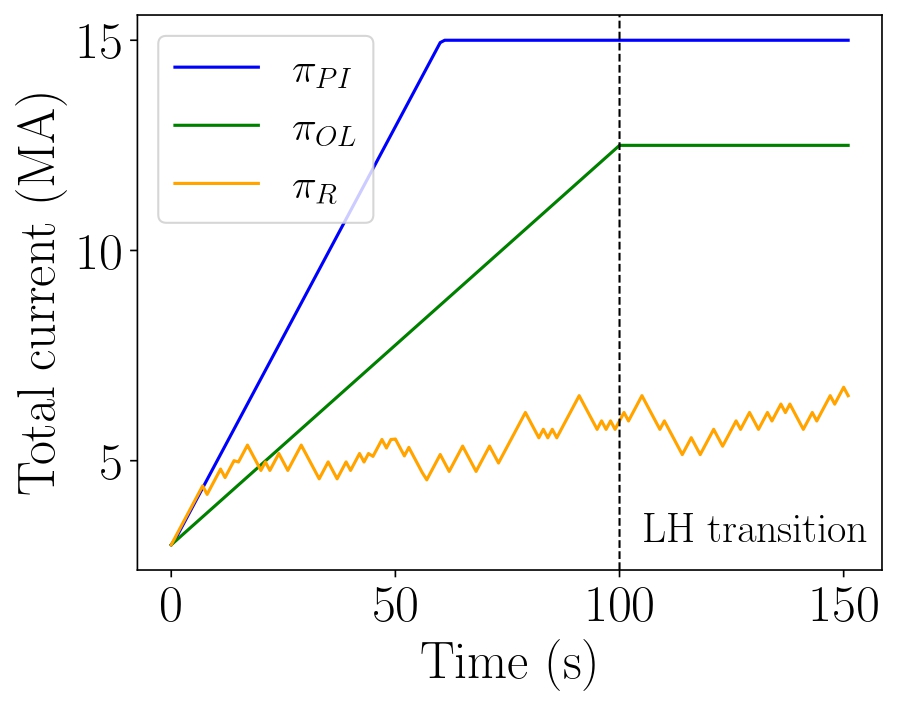
Figure 1 Comparison of one action (total current) trajectory for each policy.
Figure 2 represents the target evolution of the PI controller and the action taken by the PI controller-based policy. Note that the parameters were optimized to maximize the expected return, rather than having actions close to the target, which can be observed in the figure.
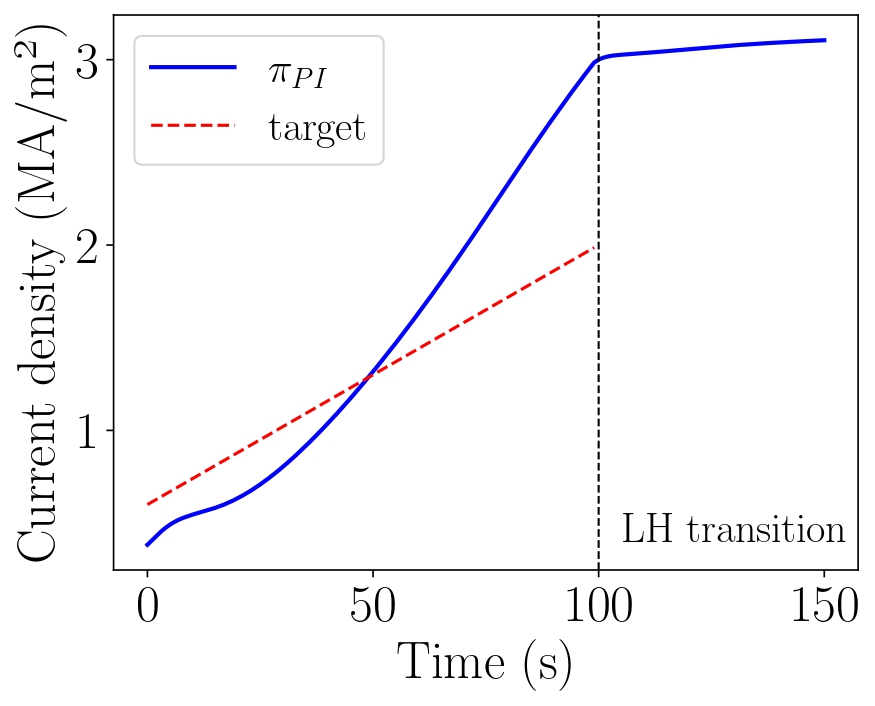
Figure 2 Evolution of the current density with respect to the target.